LTC and Solana’s SOL Maintain $140 Support Amid Bullish Reversal Signals
Market Overview: Solana’s SOL Experiences Temporary Dip with Signs of Reversal
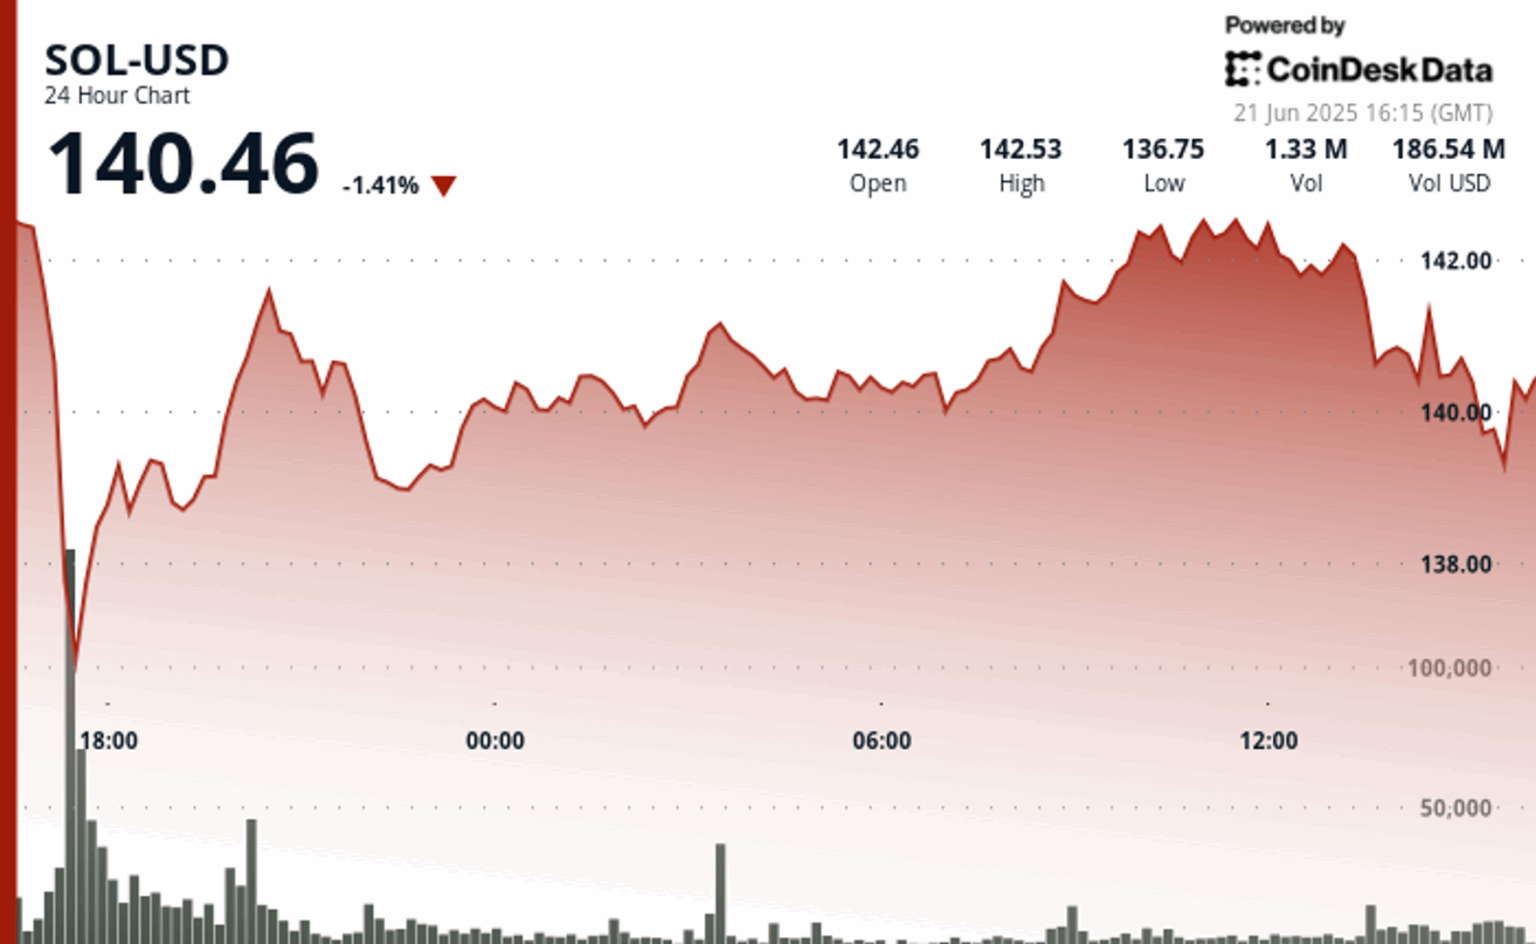
As of June 21, 2025, Solana’s native token, SOL, has shown resilience despite recent volatility. The cryptocurrency recently dipped approximately 5% before finding stability around the $140 mark. Technical analysis indicates that a bullish reversal pattern is emerging, suggesting the potential for an upward breakout if key resistance levels are surpassed.
Recent Price Movements and Key Technical Indicators
Over the past 24 hours, SOL traded within a range of $135.96 to $142.91, closing near $140.46. The token initially declined sharply from a high of $142.91 to a low of $135.96, a move representing a 4.9% decrease. Since then, it has consolidated, with strong support forming at approximately $140.40, supported by high trading volume.
The current technical setup features a descending channel coupled with a bullish reversal pattern, both of which are gaining traction among traders. To confirm a breakout, SOL must breach the resistance barrier at around $142.65. A successful move above this level could open the door to higher price targets, potentially reaching $200 in the medium term, according to some market analysts.
Market Sentiment and Ecosystem Developments
Despite the recent dip, Solana’s ecosystem continues to expand rapidly. Notably, the network has recently announced support for wrapped Bitcoin (WBTC), enhancing its interoperability and DeFi capabilities. This development has bolstered confidence among investors, although opinions remain divided on the near-term trajectory. Some experts forecast a rally toward $200, driven by increased adoption and network upgrades, while others anticipate a retracement back to the $123-$135 zone before resuming upward momentum.
In-Depth Technical Analysis
- The decline from $142.91 to $135.96 marked a significant 4.9% correction, establishing a trading range of approximately 7.08 points.
- Following this correction, SOL entered a consolidation phase between $140 and $142, indicating a potential accumulation zone.
- During the early afternoon, high-volume support was observed at $140.40, reinforcing this level as a critical support zone.
- A brief surge from $140.48 to $141.40 was recorded between 14:32 and 14:37, but selling pressure pushed the price back down to a session low of $140.29.
- The formation of a descending channel with lower highs and lower lows suggests short-term bearish sentiment, yet the presence of a bullish reversal pattern hints at a possible shift.
- Resistance at $142.65 has been tested twice, preventing further upward movement, while increased selling volume during the 15:10 candle indicates cautious market sentiment.
Expert Insights and Future Outlook
While some analysts remain optimistic about SOL reaching new highs, caution is advised as the asset approaches critical resistance levels. A breakout above $142.65 with sustained volume could signal a bullish trend continuation, potentially targeting $200 or higher. Conversely, failure to break this resistance might lead to a retest of lower support levels, possibly around $123.
Disclaimer: Portions of this analysis were generated with the assistance of AI tools and reviewed by our editorial team to ensure accuracy and compliance with our standards. For more details, please refer to CoinDesk’s full AI Policy.
About the Analysts
Siamak Masnavi is a seasoned researcher specializing in blockchain technology, cryptocurrency regulations, and macroeconomic trends influencing the digital asset market. Holding a PhD in computer science from the University of London, Siamak has a background in software development and banking, with experience in London and Zurich. Since transitioning to cryptocurrency journalism in 2018, he has focused on in-depth research and analysis of market dynamics.
Market Data and Analytical Tools
CoinDesk Analytics, our AI-powered market analysis platform, synthesizes real-time data and expert insights to produce comprehensive reports on cryptocurrency price movements and market trends. All outputs undergo human review to ensure transparency, accuracy, and adherence to editorial standards.
Note: This article is intended for informational purposes and should not be considered financial advice. Always conduct your own research before making investment decisions.

